Understanding Regression Analysis
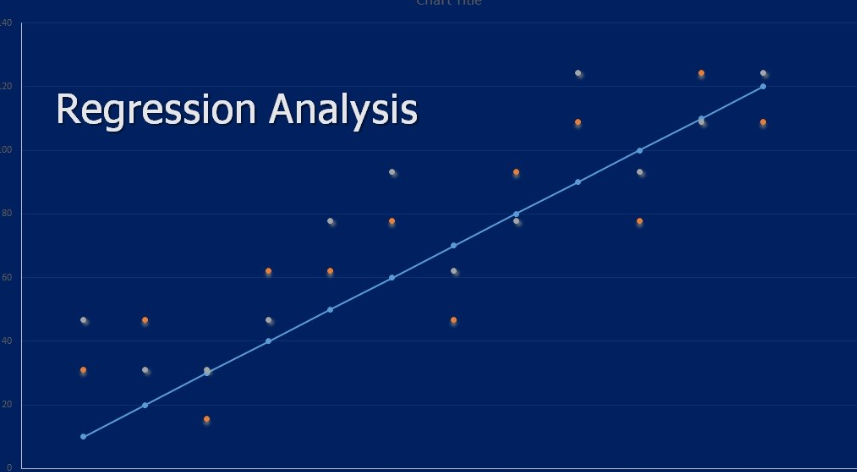
Regression analysis is a powerful statistical method used to examine the relationship between one dependent variable and one or more independent variables. It’s a fundamental tool in data science, enabling us to understand and predict behaviors, trends, and patterns. This blog will provide a deep dive into regression analysis, exploring its various types, the mathematical foundation behind it, and how to apply it using real-life examples.
Table of Contents
- What is Regression Analysis?
- Types of Regression Analysis
- Simple Linear Regression
- Multiple Linear Regression
- Polynomial Regression
- Logistic Regression
- Ridge and Lasso Regression
- Mathematical Foundation of Regression Analysis
- Least Squares Method
- Coefficient of Determination (R²)
- Assumptions of Regression Analysis
- Steps in Conducting Regression Analysis
- Real-Life Example: Housing Prices Prediction
- Interpreting the Results
- Common Pitfalls and How to Avoid Them
- Conclusion
1. What is Regression Analysis?
Regression analysis is a statistical technique used to determine the relationship between variables. It helps in understanding how the typical value of the dependent variable changes when any one of the independent variables is varied while the other independent variables are held fixed. Essentially, it’s about fitting a model to your data and using it to make predictions or infer causal relationships.
2. Types of Regression Analysis
Simple Linear Regression
Simple linear regression is used to model the relationship between a single independent variable and a dependent variable by fitting a linear equation to observed data. The equation has the form:


Multiple Linear Regression
Multiple linear regression extends the simple linear regression model to include multiple independent variables. The equation is:

Polynomial Regression
Polynomial regression is a type of multiple linear regression where the relationship between the independent variable and the dependent variable is modeled as an nth degree polynomial. It’s useful for capturing non-linear relationships.
Logistic Regression
Logistic regression is used for binary classification problems. It models the probability that a given input point belongs to a certain class. The logistic function is used to constrain the output between 0 and 1:

Ridge and Lasso Regression
Ridge and Lasso regression are types of linear regression that include regularization penalties to prevent overfitting. Ridge regression adds an L2 penalty (squared magnitude of coefficients), while Lasso regression adds an L1 penalty (absolute value of coefficients).
3. Mathematical Foundation of Regression Analysis
Least Squares Method
The least squares method is used to estimate the coefficients of the regression equation. It minimizes the sum of the squares of the differences between observed and predicted values.

Assumptions of Regression Analysis
- Linearity: The relationship between the dependent and independent variables is linear.
- Independence: The observations are independent.
- Homoscedasticity: The variance of error terms is constant.
- Normality: The error terms are normally distributed.
4. Steps in Conducting Regression Analysis
- Define the Problem: Identify the dependent and independent variables.
- Collect Data: Gather relevant data for analysis.
- Explore Data: Conduct exploratory data analysis (EDA) to understand the data.
- Choose the Model: Select the appropriate regression model.
- Fit the Model: Use statistical software to fit the model to the data.
- Validate the Model: Check the model’s assumptions and validate its performance.
- Interpret Results: Analyze the coefficients and make predictions.
- Refine the Model: Improve the model based on validation results.
5. Real-Life Example: Housing Prices Prediction
Problem Definition
Predict the price of houses based on various features such as size, location, number of bedrooms, etc.
Data Collection
Assume we have a dataset with the following columns:
- Price (dependent variable)
- Size (independent variable)
- Location (independent variable)
- Number of bedrooms (independent variable)
- Age of the house (independent variable)
Exploratory Data Analysis
EDA involves visualizing the data, checking for missing values, and understanding the distribution of each variable.
Choosing the Model
For simplicity, we’ll start with a multiple linear regression model.
Fitting the Model
Using statistical software (e.g., Python’s scikit-learn), we fit the regression model to the data.

Validating the Model
We validate the model by checking R² and conducting residual analysis.
Interpreting the Results
The coefficients indicate how much the dependent variable (house price) changes with a one-unit change in the independent variables, holding other variables constant.
6. Interpreting the Results
- Intercept: The expected mean value of the dependent variable when all independent variables are zero.
- Coefficients: Each coefficient represents the change in the dependent variable for a one-unit change in the corresponding independent variable.
- R² Value: Indicates the goodness of fit. A higher R² value means a better fit.
7. Common Pitfalls and How to Avoid Them
- Overfitting: Occurs when the model is too complex. Use regularization techniques like Ridge and Lasso to avoid overfitting.
- Multicollinearity: When independent variables are highly correlated. Use variance inflation factor (VIF) to detect and address multicollinearity.
- Assumption Violations: Ensure that the regression assumptions are not violated. Use diagnostic plots and tests to check for violations.
8. Conclusion
Regression analysis is a vital tool in data science for understanding relationships and making predictions. By following the steps outlined in this blog and being mindful of common pitfalls, you can effectively apply regression analysis to real-life problems.
This comprehensive guide should serve as a foundation for anyone looking to deepen their understanding of regression analysis. Whether predicting housing prices, analyzing sales trends, or studying economic indicators, regression analysis offers a robust framework for extracting insights from data.


