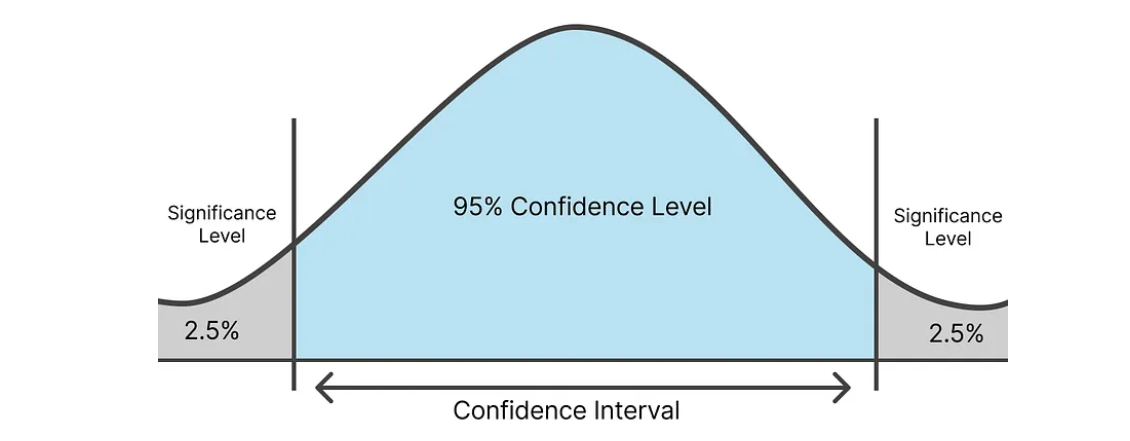
A confidence interval (CI) is a range of values that is used to estimate the true value of a population parameter. The interval has an associated confidence level that quantifies the level of confidence that the parameter lies within the interval. For example, a 95% confidence interval suggests that if we were to take 100 different samples and compute a CI for each sample, then approximately 95 of the 100 confidence intervals will contain the population parameter.
Key Components of a Confidence Interval
- Point Estimate: This is the statistic calculated from the sample data (e.g., sample mean).
- Margin of Error: This accounts for the sampling variability and is typically calculated as the product of a critical value (from the z or t distribution) and the standard error of the point estimate.
- Confidence Level: This is the percentage of all possible samples that can be expected to include the true population parameter.
Real-Life Examples of Confidence Intervals
Example 1: Election Polls
Imagine a political analyst conducts a survey to estimate the percentage of voters who support a particular candidate. If the survey results show that 55% of respondents support the candidate with a 95% confidence interval of ±3%, the analyst can be 95% confident that between 52% and 58% of the total voter population supports the candidate.
- Point Estimate: 55%
- Margin of Error: ±3%
- Confidence Interval: 52% to 58%
Example 2: Quality Control in Manufacturing
A factory produces light bulbs, and the quality control team wants to estimate the average lifespan of a batch of bulbs. They test a sample and find an average lifespan of 1,000 hours with a 95% confidence interval of ±50 hours. This means the true average lifespan of all bulbs produced is likely between 950 and 1,050 hours.
- Point Estimate: 1,000 hours
- Margin of Error: ±50 hours
- Confidence Interval: 950 to 1,050 hours
Calculating a Confidence Interval
The formula for a confidence interval for a population mean (μ) when the population standard deviation (σ) is known is:
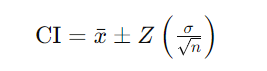
Where:

Importance of Confidence Intervals
Confidence intervals provide a range of plausible values for a population parameter, offering more information than a simple point estimate. They help in understanding the precision of the estimate and the degree of uncertainty associated with it.
Conclusion
Confidence intervals are a fundamental concept in statistics that allow researchers and analysts to estimate population parameters with a known level of confidence. By providing a range within which the true parameter is expected to lie, confidence intervals help make informed decisions in various fields, from politics and manufacturing to healthcare and finance.