Descriptive and Inferential Statistics
Statistics is a powerful tool used in data science to analyze, interpret, and present data. It helps us make sense of large datasets, uncover patterns, and make informed decisions. There are two main branches of statistics: descriptive and inferential. This blog post will provide a concise overview of these two types of statistics, highlighting their key concepts and demonstrating their applications with examples.
Descriptive Statistics
Descriptive statistics involves summarizing and organizing data to describe its main characteristics. This type of statistics is focused on presenting data in a way that provides an overall understanding of the dataset without making any inferences or predictions about the population from which the data was drawn.
Key Concepts
- Measures of Central Tendency: These measures describe the center or typical value of a dataset.
- Mean: The arithmetic average of all data points.
- Median: The middle value when the data points are sorted in ascending or descending order.
- Mode: The most frequently occurring value in the dataset.
- Measures of Variability: These measures describe the spread or dispersion of data points in a dataset.
- Range: The difference between the highest and lowest values.
- Variance: The average of the squared differences from the mean.
- Standard Deviation: The square root of the variance, indicating the average distance of each data point from the mean.
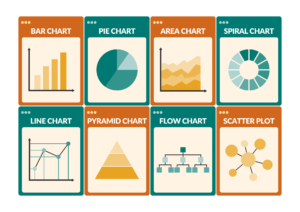
- Data Visualization: Graphical representations of data help to visualize its distribution and identify patterns.
- Histograms: Show the frequency distribution of a dataset.
- Box Plots: Display the distribution of data based on a five-number summary (minimum, first quartile, median, third quartile, and maximum).
- Scatter Plots: Illustrate the relationship between two variables.

Data Visualization
- Histogram: A histogram of the test scores can show how frequently each score range occurs.
- Box Plot: A box plot can illustrate the spread and identify any potential outliers in the test scores.
Inferential Statistics
Inferential statistics involves making predictions or inferences about a population based on a sample of data. This branch of statistics allows us to draw conclusions that extend beyond the immediate data alone.
Key Concepts
- Population and Sample:
- Population: The entire group of individuals or items that we are interested in studying.
- Sample: A subset of the population that is selected for analysis.
- Parameter and Statistic:
- Parameter: A numerical characteristic of a population (e.g., population mean).
- Statistic: A numerical characteristic of a sample (e.g., sample mean).

Example
Consider a scenario where a company wants to determine if a new marketing campaign has increased sales. They collect sales data from 30 stores before and after implementing the campaign.
- Sample Data: Collect sales data from a random sample of 30 stores.
- Hypothesis Testing:
- Null Hypothesis (H0): The marketing campaign has no effect on sales.
- Alternative Hypothesis (H1): The marketing campaign has increased sales.
- Confidence Interval: Calculate a 95% confidence interval for the increase in sales. If the interval is [2.5, 7.5], it suggests that the true increase in sales is between 2.5 and 7.5 units.
- Regression Analysis: Use linear regression to model the relationship between sales (dependent variable) and marketing expenditure (independent variable). The resulting equation might look like:

- This equation suggests that for every unit increase in marketing expenditure, sales increase by 1.2 units.
Data Visualization
- Scatter Plot: A scatter plot of sales against marketing expenditure can help visualize the relationship and the regression line.
- Confidence Interval Plot: A plot showing the confidence interval for the increase in sales provides a visual representation of the uncertainty around the estimate.
Conclusion
Descriptive and inferential statistics are two fundamental branches of statistics that serve different purposes. Descriptive statistics helps us summarize and understand the main characteristics of a dataset, while inferential statistics allows us to make predictions and draw conclusions about a population based on sample data.
In data science, both types of statistics are essential. Descriptive statistics provides the foundation for data exploration and visualization, enabling us to identify patterns and trends. Inferential statistics builds on this foundation, allowing us to test hypotheses, estimate population parameters, and build predictive models.
By mastering these statistical techniques, data scientists can uncover valuable insights, make informed decisions, and drive meaningful actions based on data. Whether you are analyzing test scores, evaluating a marketing campaign, or modeling complex relationships, understanding the principles of descriptive and inferential statistics is crucial for success in the field of data science.


