Mastering the Pandas Library in Python
The Pandas library is a cornerstone of data analysis and manipulation in Python, offering robust tools to work with structured data efficiently. Designed with simplicity and performance in mind, Pandas empowers data scientists, analysts, and developers to handle data-related tasks seamlessly. Whether you are dealing with small datasets or massive ones, Pandas provides the functionality and flexibility to transform raw data into actionable insights. In this blog, we will delve into the features, advantages, and essential operations of Pandas with detailed explanations and examples.
What is Pandas?
Pandas is an open-source Python library built on top of NumPy. It introduces two primary data structures, Series and DataFrame, to handle one-dimensional and two-dimensional data, respectively. Pandas excels at data cleaning, manipulation, and exploration, making it an essential library in the data science ecosystem.
Key Features of Pandas:
Flexible Data Structures: Efficient handling of structured data with intuitive indexing.
Data Cleaning Tools: Handle missing data, duplicates, and type conversion effortlessly.
Powerful Aggregation: Built-in methods for summarizing and analyzing data.
Integration: Works seamlessly with libraries like Matplotlib, NumPy, and Scikit-learn.
Wide Format Support: Read and write data in formats like CSV, Excel, JSON, SQL, and more.
Core Data Structures in Pandas
1. Series:
A Series is a one-dimensional labeled array capable of holding any data type, including integers, floats, and strings. It is similar to a list or a column in a spreadsheet.
Example:
					import pandas as pd

# Creating a Series
data = pd.Series([10, 20, 30, 40], index=['A', 'B', 'C', 'D'])
print(data)
Output:
A 10
B 20
C 30
D 40
dtype: int64
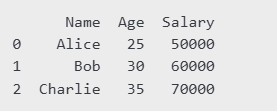
2. DataFrame:
A DataFrame is a two-dimensional, size-mutable, and heterogeneous data structure. It is akin to a table in a relational database or an Excel spreadsheet.
Example:
					# Creating a DataFrame
data = {
    "Name": ["Alice", "Bob", "Charlie"],
    "Age": [25, 30, 35],
    "Salary": [50000, 60000, 70000]
}
df = pd.DataFrame(data)
print(df)
Output :
Essential Pandas Operations
1. Reading and Writing Data:
Pandas supports reading data from and writing data to various formats like CSV, Excel, JSON, and SQL.
Reading a CSV file:
					# Reading data from a CSV file
df = pd.read_csv("data.csv")
print(df.head())
Writing to an Excel file:
					# Writing data to an Excel file
df.to_excel("output.xlsx", index=False)
2. Data Exploration:
Understanding the dataset is crucial before performing any operations.
					print(df.info())      # Provides a concise summary of the DataFrame
print(df.describe())  # Generates descriptive statistics
print(df.shape)       # Returns the dimensions of the DataFrame
3. Indexing and Selecting Data:
Pandas offers multiple ways to access and modify data
					# Selecting a column
df["Name"]

# Selecting multiple columns
df[["Name", "Age"]]

# Filtering rows based on conditions
filtered_df = df[df["Age"] > 28]
4. Modifying Data:
Adding new columns, renaming columns, or modifying existing data is straightforward.
					# Adding a new column
df["Bonus"] = df["Salary"] * 0.10

# Renaming columns
df.rename(columns={"Salary": "Income"}, inplace=True)
5. Handling Missing Data:
Missing data is a common challenge in real-world datasets.
					# Replacing missing values
df.fillna(0, inplace=True)

# Dropping rows with missing values
df.dropna(inplace=True)
6. Grouping and Aggregation:
Pandas’ grouping functionality allows for advanced data aggregation.
					# Grouping by a column and calculating the mean
grouped = df.groupby("Age")["Income"].mean()
print(grouped)
Advanced Pandas Operations
1. Merging and Joining DataFrames:
Combine data from multiple DataFrames using merge or join operations
					df1 = pd.DataFrame({"ID": [1, 2], "Name": ["Alice", "Bob"]})
df2 = pd.DataFrame({"ID": [1, 2], "Age": [25, 30]})

# Merging on a common column
merged_df = pd.merge(df1, df2, on="ID")
2. Pivot Tables:
Summarize data using pivot tables, similar to Excel functionality
					pivot_table = df.pivot_table(values="Income", index="Age", aggfunc="mean")
print(pivot_table)
3. Time Series Analysis:
Pandas has robust support for time series data, enabling date parsing, resampling, and rolling calculations
					# Creating a time series
time_data = pd.date_range("2023-01-01", periods=5)
ts = pd.Series([100, 200, 300, 400, 500], index=time_data)

# Resampling
ts_resampled = ts.resample("2D").sum()
Visualization with Pandas
Pandas integrates seamlessly with Matplotlib for quick visualizations. These visualizations help in identifying trends and patterns in the data.
Example:
					import matplotlib.pyplot as plt

# Plotting a bar chart
df["Age"].value_counts().plot(kind="bar", title="Age Distribution")
plt.show()
Benefits of Using Pandas
Ease of Use: Pandas’ intuitive syntax simplifies complex data operations.
Versatility: Supports diverse data formats and integrates well with Python’s ecosystem.
Performance: Built on NumPy, Pandas is optimized for speed and efficiency.
Community Support: Extensive documentation and a large user community make it easy to learn and troubleshoot.