Explore - Roadmap to learn Data Science

Data science has emerged as a crucial discipline across various industries, integrating mathematics, programming, and domain expertise to derive insights from data. Whether you’re a beginner or looking to enhance your skills, following a structured roadmap is essential for mastering data science. Here’s a comprehensive roadmap to guide your journey:
1. Basic Prerequisites
a. Mathematics Foundations
Mathematics is the backbone of data science. A strong understanding of the following topics is essential:
- Linear Algebra: This helps in understanding how data is transformed, especially in machine learning algorithms. Concepts like matrices, vectors, and eigenvalues are frequently used.
- Example: A recommendation system like Netflix uses matrix factorization to predict user preferences based on historical data.
- Calculus: Essential for understanding optimization and learning algorithms. Gradients and derivatives are key concepts in training models.
- Example: In a neural network, backpropagation uses derivatives to minimize error and optimize the model.
- Probability and Statistics: These are the foundation for data analysis and machine learning algorithms. Understanding distributions, hypothesis testing, and sampling is crucial.
- Example: Predicting the probability of customer churn can be modeled using statistical techniques like logistic regression.
b. Programming Skills
Python is the most popular language in data science due to its simplicity and a vast ecosystem of libraries. Learn the following:
- Python Basics: Focus on data structures (lists, dictionaries), loops, conditionals, and functions.
- Libraries:
- NumPy: For numerical computations and array manipulations.
- pandas: For data manipulation, handling missing data, and dealing with large datasets.
- Matplotlib/Seaborn: For data visualization.
- Example: Using
pandas, you can easily load and manipulate datasets. A common task would be cleaning missing data from a dataset of customer orders.
2. Data Manipulation and Exploration
a. Data Wrangling
Data is often messy, so cleaning it is a significant part of a data scientist’s job. This includes handling missing data, removing duplicates, and normalizing formats.
- Example: Suppose you are analyzing sales data where some rows have missing customer IDs. You might use
pandasto fill in missing values or remove incomplete rows.
b. Exploratory Data Analysis (EDA)
EDA helps to understand the underlying patterns in data before applying machine learning models.
- Techniques: Use summary statistics (mean, median, mode) and visualizations (scatter plots, histograms) to uncover trends.
- Example: If analyzing housing prices, you might create scatter plots to see how house size correlates with price.
c. SQL
SQL is essential for querying databases and handling structured data. You’ll need to perform operations like:
- SELECT, JOIN, GROUP BY, HAVING, and aggregation functions like SUM, AVG.
- Example: Retrieving customer purchase history from a database to find the top 10 highest spenders.
3. Data Visualization
Presenting data in a meaningful way is crucial in data science, and data visualization tools help achieve that.
a. Matplotlib and Seaborn
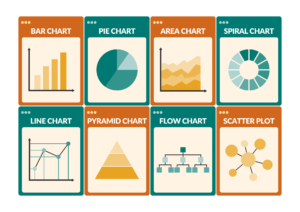
These libraries in Python help create basic visualizations like bar charts, histograms, and scatter plots.
- Example: Visualizing sales trends over time using a line chart to understand seasonality effects.
b. Advanced Visualization (Plotly, Tableau)
Plotly allows interactive visualizations, while Tableau is a powerful tool for creating dashboards.
- Example: Building an interactive dashboard to show real-time sales data, helping decision-makers track KPIs.
4. Machine Learning
Machine learning enables systems to learn from data without being explicitly programmed. You’ll start with supervised learning and unsupervised learning.
a. Supervised Learning
Algorithms learn from labeled data to make predictions or classifications. Key algorithms include:
- Linear Regression: Used to predict a continuous variable (e.g., house prices).
- Logistic Regression: For binary classification (e.g., spam detection).
- Decision Trees and Random Forest: For both regression and classification tasks.
- Example: Predicting whether a loan application will be approved based on customer data using logistic regression.
b. Unsupervised Learning
These algorithms deal with unlabeled data. Common algorithms include:
- Clustering (K-Means): Used to group similar data points.
- PCA (Principal Component Analysis): For dimensionality reduction, which simplifies datasets while retaining essential information.
- Example: Customer segmentation based on purchasing behavior using K-Means clustering.
c. Model Evaluation
Understanding how to evaluate the performance of your machine learning models is essential. Use metrics like accuracy, precision, recall, and F1-score.
- Example: Evaluating a fraud detection model using precision and recall to understand how well it identifies fraudulent transactions.
5. Deep Learning
Deep learning is a subset of machine learning that uses neural networks to model complex patterns.
a. Neural Networks
Start with understanding how basic neural networks work—feed-forward networks and backpropagation.
- Example: A basic neural network can be used to classify handwritten digits from the MNIST dataset.
b. Deep Learning Libraries
- TensorFlow/PyTorch: These libraries help build and train deep learning models.
c. Advanced Deep Learning
- Convolutional Neural Networks (CNN): Commonly used in image recognition tasks (e.g., facial recognition).
- Recurrent Neural Networks (RNN): Suitable for sequence data like time series and natural language processing.
- Example: Using RNN for stock price prediction based on historical price data.
6. Data Engineering Skills
As a data scientist, you might handle large datasets, and understanding data engineering concepts can be beneficial.
a. Big Data Frameworks (Hadoop, Spark)
These tools are designed for processing vast amounts of data.
- Example: Use Apache Spark to distribute data processing tasks across clusters for faster computation.
b. Building Data Pipelines
You need to automate data workflows, ensuring that the right data flows between systems.
- Example: Automating an ETL (Extract, Transform, Load) pipeline that fetches daily data, cleans it, and stores it in a data warehouse.
7. Natural Language Processing (NLP)
NLP allows you to work with text data, opening up opportunities in sentiment analysis, chatbots, and more.
a. Text Preprocessing
This involves cleaning text data through techniques like tokenization, stemming, lemmatization, and removing stop words.
- Example: Cleaning customer reviews by removing stop words and stemming words for sentiment analysis.
b. NLP Algorithms
Learn techniques like Bag of Words, TF-IDF, and Word Embeddings (Word2Vec, GloVe).
c. Advanced NLP (Transformers)
Transformer models like BERT and GPT have revolutionized NLP tasks.
- Example: Building a question-answering system using the BERT model.
8. Time Series Analysis
Time series data analysis is important for forecasting future events.
a. Basic Concepts
Understand components like trend, seasonality, and noise in time series data.
b. Time Series Models
Models like ARIMA, SARIMA, and Prophet are widely used for time series forecasting.
- Example: Forecasting future sales based on historical sales data using ARIMA.
9. Model Deployment and MLOps
After building models, the next step is to deploy them into production.
a. Model Deployment
Learn to deploy models using web frameworks like Flask/Django and cloud platforms like AWS, Google Cloud, or Azure.
b. MLOps
MLOps (Machine Learning Operations) integrates machine learning models into production systems, focusing on continuous integration, deployment, and scaling.
- Example: Deploying a recommendation engine to a web application using Docker for containerization.
10. Projects and Portfolio
Building real-world projects and showcasing them is key to standing out in the job market.
a. Kaggle Competitions
Kaggle is a platform for practicing data science skills by participating in competitions.
b. Building a Portfolio
Create a GitHub repository with your projects and a portfolio website to showcase your work to potential employers.
11. Soft Skills and Domain Expertise
a. Communication Skills
Being able to communicate insights clearly and concisely is a critical skill.
b. Domain Expertise
Focus on industries like healthcare, finance, or marketing, depending on your interest, to understand specific applications of data science.
12. Stay Updated
Data science is a rapidly evolving field. Keep learning by reading research papers, following blogs.
Conclusion
Becoming a data scientist requires consistent learning, practice, and staying updated with industry trends. Following this roadmap step by step will help you gain a comprehensive understanding of data science, from basic mathematics and programming to advanced machine learning and deep learning techniques.


