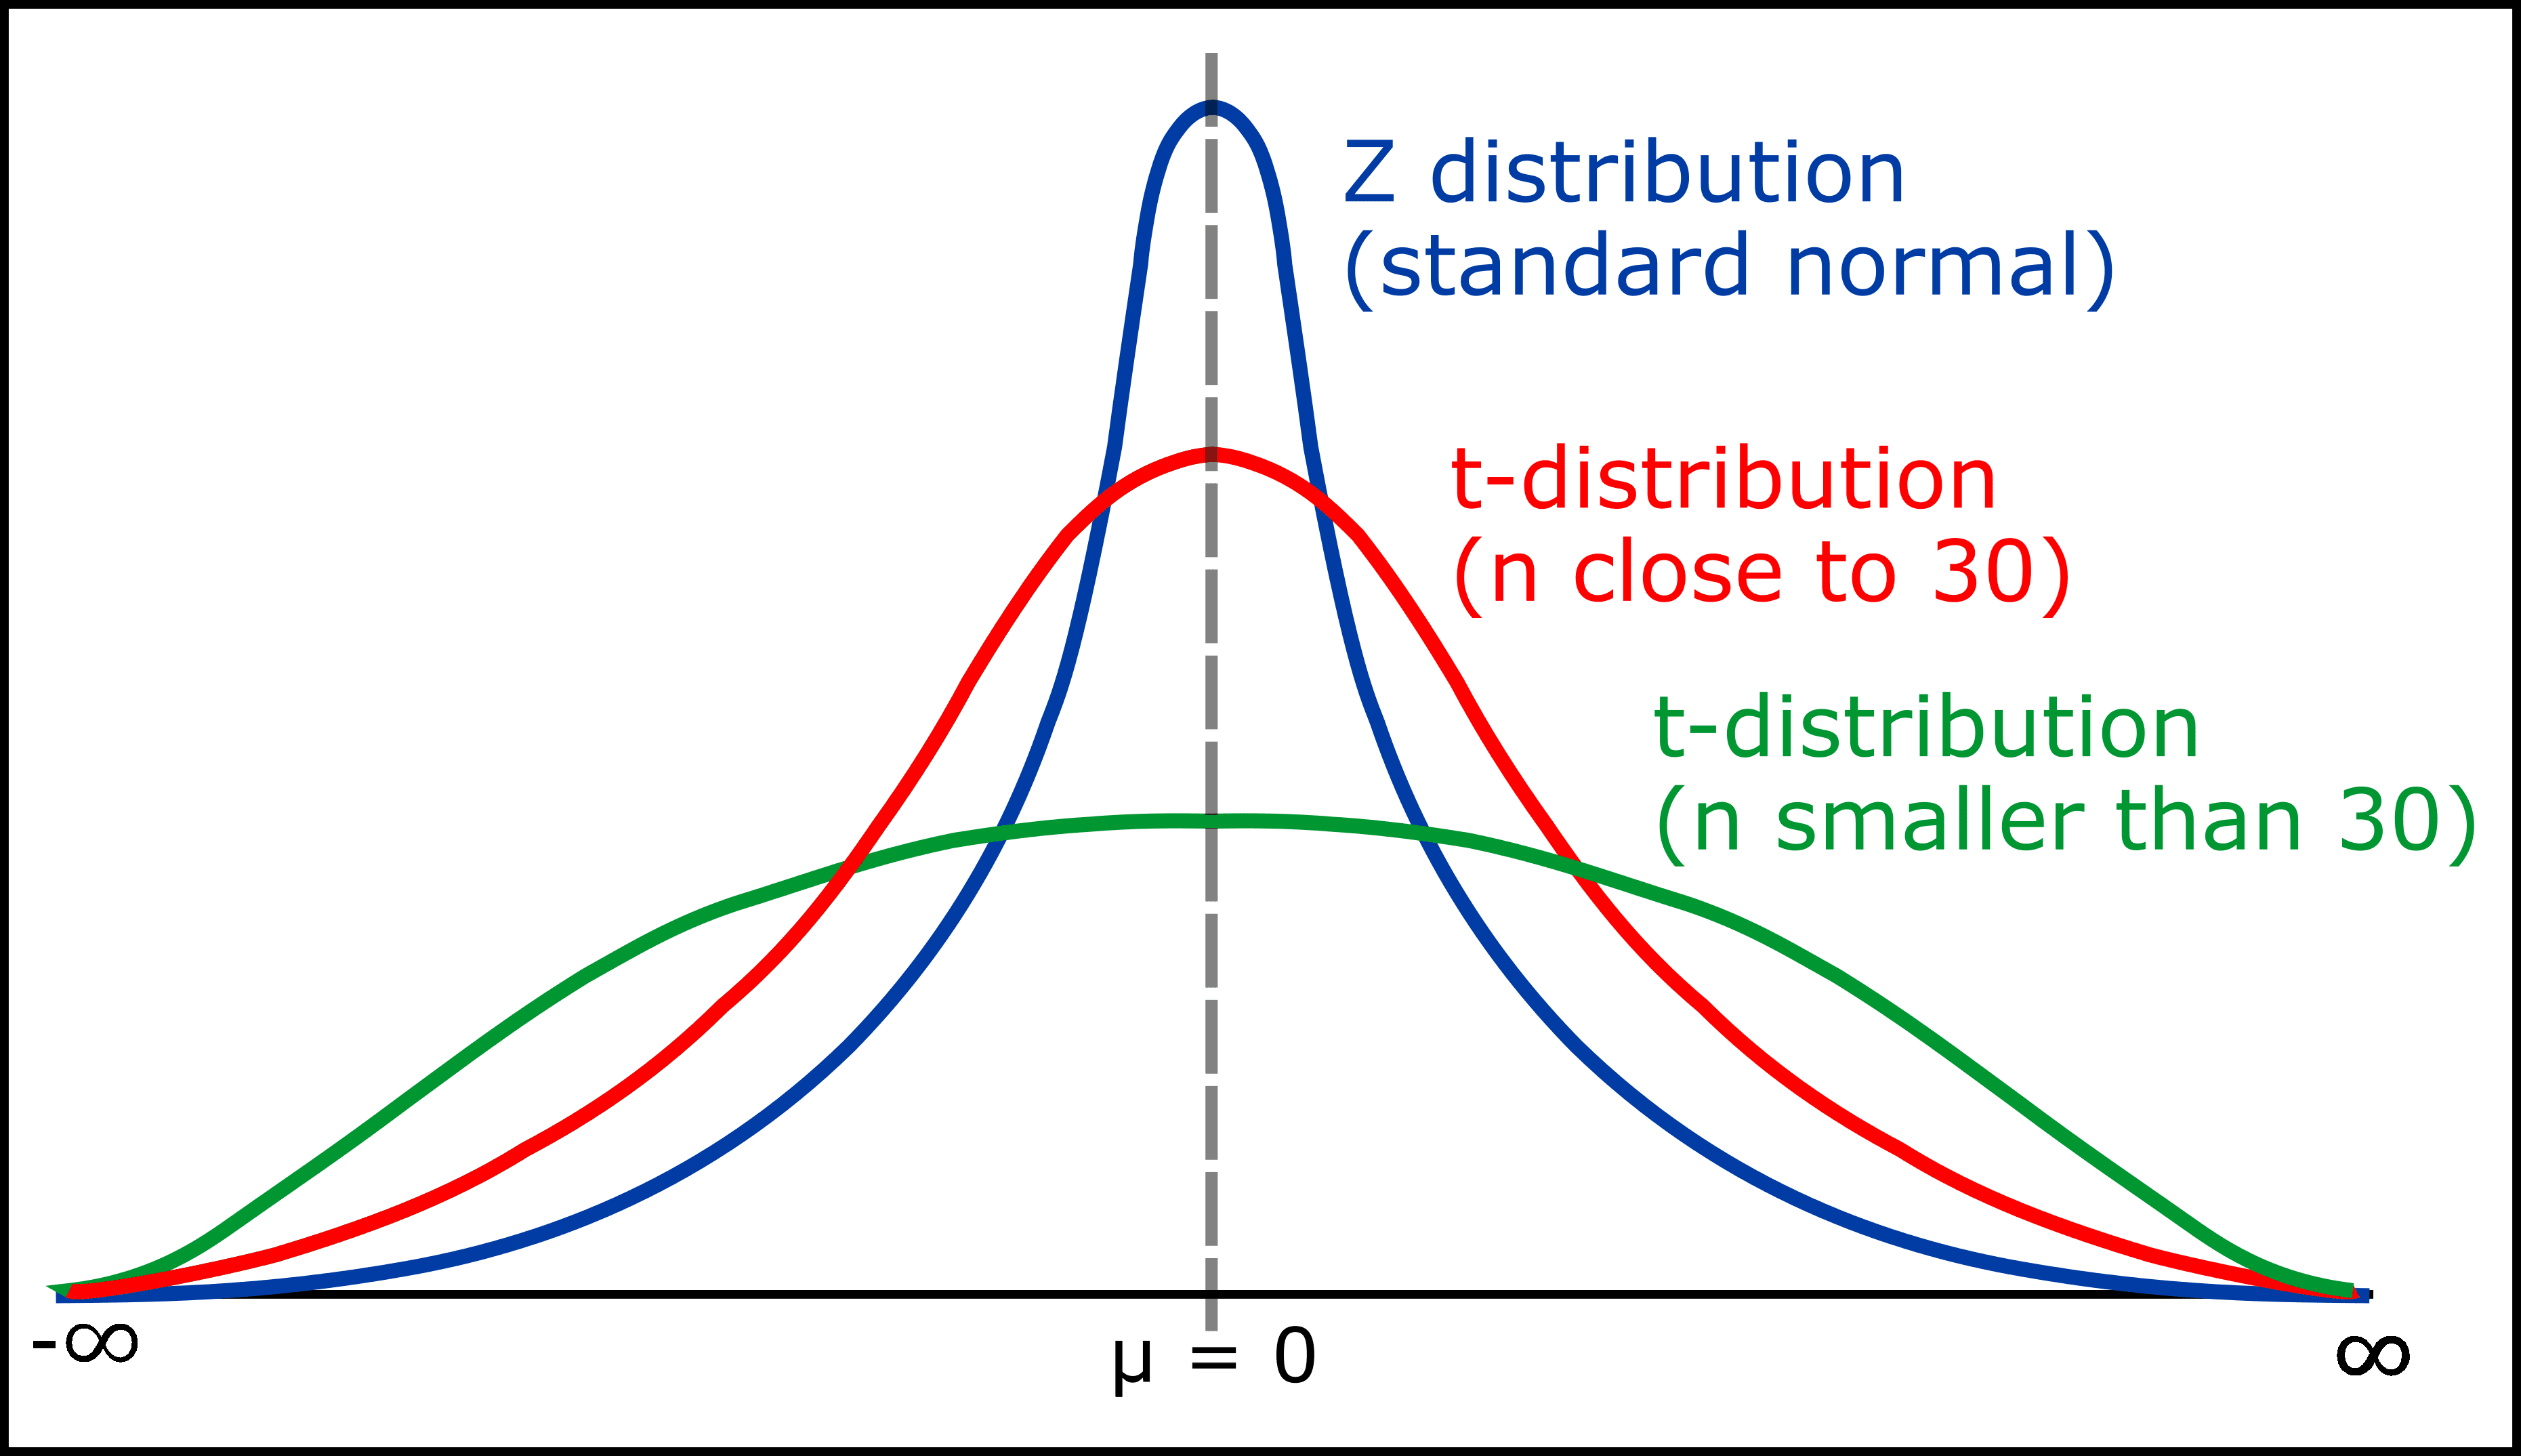
Lets Learn T- test , Chi-Square test , Z - test
T-Test
A T-Test is a statistical test used to compare the means of two groups. It helps determine if the differences between the groups are statistically significant.
Types of T-Tests:
- Independent T-Test: Compares the means of two independent groups.
- Paired T-Test: Compares the means from the same group at different times.
- One-Sample T-Test: Compares the mean of a single group against a known mean.
Example:
Suppose we want to compare the test scores of students from two different teaching methods (Method A and Method B).
Independent T-Test Example:
- Null Hypothesis (H0): There is no significant difference in the mean scores between the two methods.
- Alternative Hypothesis (H1): There is a significant difference in the mean scores between the two methods.
Given the scores:
- Method A: [85, 87, 90, 88, 86]
- Method B: [78, 82, 80, 83, 79]
We would conduct an independent t-test to compare the means of these two groups.
Chi-Square Test
A Chi-Square Test is used to determine if there is a significant association between two categorical variables. It is based on the comparison of observed and expected frequencies.
Types of Chi-Square Tests:
- Chi-Square Test for Independence: Tests if there is a significant relationship between two categorical variables.
- Chi-Square Goodness of Fit Test: Tests if a sample data matches a population.
Example:
Suppose we want to determine if there is an association between gender (Male, Female) and preference for a new product (Like, Dislike).
Chi-Square Test for Independence Example:
- Null Hypothesis (H0): There is no association between gender and product preference.
- Alternative Hypothesis (H1): There is an association between gender and product preference.
Given the data:
| Like | Dislike | |
|---|---|---|
| Male | 40 | 10 |
| Female | 30 | 20 |
We would conduct a chi-square test to see if the observed distribution of preferences differs significantly from the expected distribution.
Summary
- T-Test: Compares the means of two groups. Example: Comparing test scores between two teaching methods.
- Chi-Square Test: Assesses the relationship between two categorical variables. Example: Evaluating the association between gender and product preference.
Both tests are fundamental in statistics for hypothesis testing and help in making data-driven decisions.
Z-Test
A Z-Test is a statistical test used to determine whether there is a significant difference between the means of two groups or between a sample mean and a population mean. It is used when the sample size is large (typically n > 30) and the population variance is known.
Types of Z-Tests:
- One-Sample Z-Test: Compares the sample mean to a known population mean.
- Two-Sample Z-Test: Compares the means of two independent groups.
Assumptions:
- The data follows a normal distribution.
- The sample size is large, or the population standard deviation is known.
Example:
Suppose a company claims that the average weight of their packaged sugar is 500 grams. To verify this claim, a quality control analyst takes a random sample of 50 packages and finds the sample mean weight to be 495 grams with a known population standard deviation of 10 grams. The analyst wants to determine if the average weight of the sugar packages significantly differs from the claimed 500 grams.
One-Sample Z-Test Example:
- Null Hypothesis (H0): The average weight of the sugar packages is 500 grams (μ = 500).
- Alternative Hypothesis (H1): The average weight of the sugar packages is not 500 grams (μ ≠ 500).
Given:
- Population mean (μ0) = 500 grams
- Sample mean (x̄) = 495 grams
- Population standard deviation (σ) = 10 grams
- Sample size (n) = 50

Using the Z-table, we can determine the p-value corresponding to the Z-score of -3.54. If the p-value is less than the significance level (typically 0.05), we reject the null hypothesis.
In this example, the Z-score of -3.54 corresponds to a very small p-value (much less than 0.05), so we reject the null hypothesis and conclude that there is a significant difference between the sample mean and the claimed population mean. The company’s claim that the average weight is 500 grams is not supported by the sample data.
Summary
- Z-Test: Used to compare sample and population means or the means of two independent groups when the sample size is large and population variance is known.
- Example: Verifying a company’s claim about the average weight of packaged sugar.
The Z-Test is a powerful tool for hypothesis testing in statistics, allowing analysts to make inferences about population parameters based on sample data.


