Data Science is a multidisciplinary field that utilizes scientific methods, algorithms, and systems to extract knowledge and insights from structured and unstructured data. Central to this process is the field of statistics, which provides the foundational tools and methodologies for understanding and interpreting data. In this blog post, we will delve into the importance of statistics in Data Science, illustrating its relevance with examples.
What is Statistics?
Statistics is a branch of mathematics that deals with the collection, analysis, interpretation, presentation, and organization of data. It provides the tools for making sense of complex data sets and for making informed decisions based on data. There are two main branches of statistics: descriptive and inferential.
- Descriptive Statistics: This involves summarizing and organizing data so it can be easily understood. Examples include measures of central tendency like mean, median, and mode, and measures of variability like range, variance, and standard deviation.
- Inferential Statistics: This involves making predictions or inferences about a population based on a sample of data. Techniques include hypothesis testing, confidence intervals, and regression analysis.
The Role of Statistics in Data Science
1. Data Collection and Sampling
Before any analysis can be performed, data must be collected. Statistics provides methodologies for designing surveys and experiments, and for ensuring that the data collected is representative of the population. Techniques such as random sampling and stratified sampling help in minimizing biases and ensuring the reliability of the data.
Example: A data scientist working for a retail company might use stratified sampling to ensure that customer feedback is collected from various demographic groups, thereby providing a comprehensive understanding of customer satisfaction across different segments.
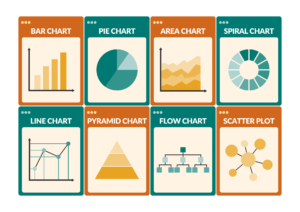
2. Data Exploration and Visualization
Exploratory Data Analysis (EDA) is a crucial step in Data Science, where descriptive statistics and visualization techniques are used to uncover patterns, spot anomalies, and test hypotheses. This helps in understanding the data’s underlying structure and guides further analysis.
Example: A data scientist analyzing sales data might use histograms to understand the distribution of sales across different regions, or box plots to identify outliers in the sales figures.
3. Hypothesis Testing
Hypothesis testing is a statistical method used to determine the validity of an assumption about a population parameter. This is crucial in Data Science for making decisions and drawing conclusions from data.
Example: Suppose a company wants to know if a new marketing campaign has increased sales. A data scientist might perform a t-test to compare the sales before and after the campaign, testing the hypothesis that the campaign has had a significant effect.
4. Regression Analysis
Regression analysis is used to understand the relationship between variables and to make predictions. It is one of the most commonly used statistical techniques in Data Science.
Example: A data scientist might use linear regression to predict housing prices based on factors such as location, size, and age of the property. By understanding the relationship between these variables, the model can make accurate price predictions for new properties.
5. Machine Learning
Many machine learning algorithms are rooted in statistical principles. Understanding these principles is crucial for selecting the right algorithm and for tuning models to improve their performance.
Example: Logistic regression, a statistical method, is widely used in machine learning for binary classification problems. A data scientist might use logistic regression to predict whether a customer will buy a product (yes/no) based on their browsing history and demographic data.
6. Evaluating Model Performance
Statistics provides the tools for evaluating the performance of predictive models. Metrics such as accuracy, precision, recall, and F1 score are essential for assessing how well a model performs.
Example: In a fraud detection system, a data scientist might use a confusion matrix to evaluate the performance of a classification model, looking at metrics like precision (the proportion of true positive results among the total predicted positives) and recall (the proportion of true positives among the actual positives).
7. Dealing with Uncertainty
Statistics helps in quantifying uncertainty and in making decisions under uncertainty. This is particularly important in Data Science, where data may be noisy or incomplete.
Example: A data scientist working on weather prediction models might use probabilistic methods to provide a range of possible outcomes, rather than a single deterministic forecast. This helps in better decision-making under uncertain conditions.
8. Time Series Analysis
Time series analysis involves analyzing data points collected or recorded at specific time intervals. It is widely used in various applications such as stock market analysis, economic forecasting, and climate studies.
Example: A data scientist might use time series analysis to predict future stock prices based on historical data. Techniques like moving averages, ARIMA (AutoRegressive Integrated Moving Average), and seasonal decomposition can help in identifying trends, seasonal patterns, and making forecasts.
Real-World Applications
Healthcare
In healthcare, statistics are used for designing clinical trials, analyzing medical data, and improving patient care. Predictive models can forecast disease outbreaks and help in personalized medicine.
Example: During the COVID-19 pandemic, statistical models were crucial in predicting the spread of the virus and in allocating resources effectively.
Finance
In the finance industry, statistics are used for risk management, fraud detection, and algorithmic trading. Statistical models help in making investment decisions and in assessing the financial health of companies.
Example: Credit scoring models use logistic regression to predict the likelihood of a borrower defaulting on a loan, helping financial institutions make informed lending decisions.
Marketing
Statistics in marketing help in customer segmentation, campaign effectiveness analysis, and market research. Data-driven insights enable companies to target the right audience and optimize their marketing strategies.
Example: A/B testing, a statistical method, is widely used to compare the effectiveness of different marketing campaigns by analyzing conversion rates.
Conclusion
Statistics is the backbone of Data Science, providing the necessary tools and methodologies for data collection, analysis, and interpretation. Its applications span across various industries, enabling data scientists to make informed decisions, predict outcomes, and solve complex problems. Whether it’s through hypothesis testing, regression analysis, or machine learning, a strong foundation in statistics is essential for any data scientist aiming to extract meaningful insights from data.
By understanding and applying statistical principles, data scientists can unlock the full potential of their data, driving innovation and creating value in an increasingly data-driven world.